It is an established fact that energetic electrons travelling through a plasma will cause the thermal electrons to oscillate about the ions in a manner that leads to electrostatic fluctuations that are called Langmuir waves. When the interplanetary magnetic field, the IMF, contacts the bow shock so as to be tangential to the surface of the shock, a beam of electrons is released which stream sunward. These energetic electrons excite Langmuir waves, which can be observed by a spacecraft in the upstream region if it is in the right position to observe that same field line. The Voyager spacecraft were not equipped to measure the energetic electrons, but they are equipped to detect Langmuir waves. So there are times when the spacecraft are approaching and leaving Saturn when Langmuir waves of the type described above are seen. We know that at this time the IMF, that is also observed by the spacecraft, is attached to the shock in a tangential manner.
The way we perform this analysis is to first examine measurements of Langmuir waves recorded by the PWS experiment on the Voyager spacecraft, identify those times with signals corresponding to tangential connection of the field lines at the shock surface, and then use that assumption together with the observed IMF direction to determine the shape and/or location of the shock.
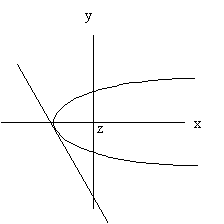 The figure to the left demonstrates the concept. The parabolic form
represents the shock surface being mapped. The straight line
represents the IMF from the spacecraft to the shock surface where it
contacts the shock as a tangent line. The solar wind flows from the
left and toward the planet in the +x direction.
By assuming either the standoff distance from the shock nose to the planet, or the width of the shock, the other parameter can be determined on an event-by-event basis. By selecting periods of similar solar wind conditions, the shock surface can be mapped. By selecting reasonable choices for either the shock width or the shock standoff distance, the movement of the shock in response to changing solar wind conditions can be determined.
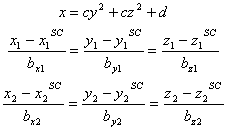
The parabolic shock surface and the straight line of the measured IMF can be written as:

where d defines the standoff distance and c relates to the width of the shock surface. The point (X0,Y0,Z0) defines the location of the spacecraft, or equivalently a point through which the straight line passes. The vector (bx,by,bz) defines the measured direction of the IMF, or equivalently the slope of the straight line. Note that the parabola and line are defined in three dimensions, although they are drawn in only two.
The solution to this problem can be written as:

The point on the parabolic shock surface where the IMF intersects (tangents) the parabola is given by:
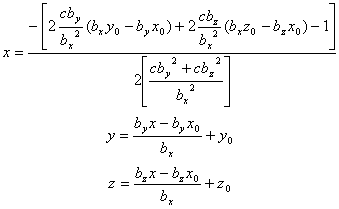
At this point, the single-point analysis is completed and the answer is obtained. All that remains is to apply the theory to the data. Before doing that, we derive an extension of the theory that describes the triangulation of the shock surface from two observations.
For a more detailed description of the 1-point analysis, you may access
an MS Word document called
Tangency of Line to Parabola.
The two-point analysis can be described according to the following
expressions. The 3-dimensional parabolic surface is unchanged, but
now two lines with independent slopes and intercept points are
defined according to:
Now, the two spacecraft locations are given by the variables
(x,y,z) with superscript sc with the subscripts
1 and 2. Likewise, the two measured directions of the IMF are
given by (bx,by,bz) with subscripts 1 and 2.
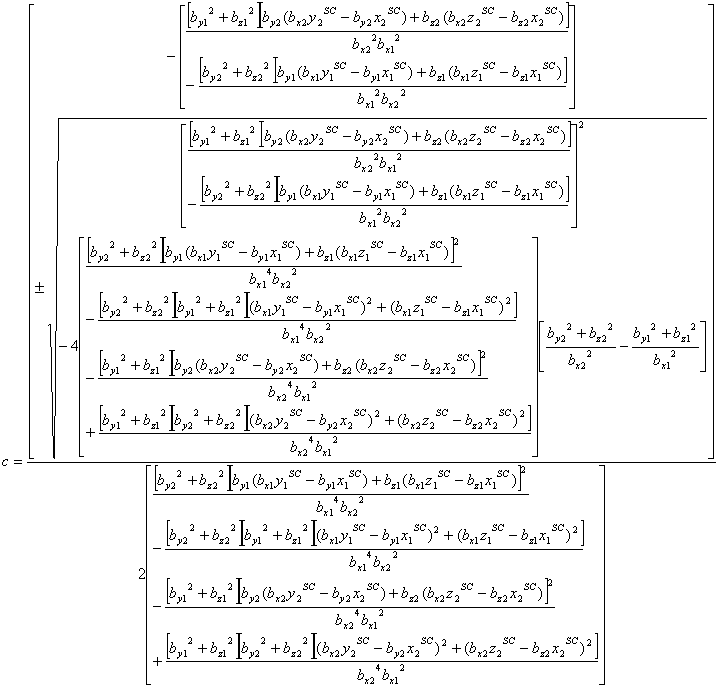
Although complicated, the solution to this problem (finding the
variables c and d along with the tangent points
where the two lines intersect the parabola) can be found. The
expressions for the solution are:
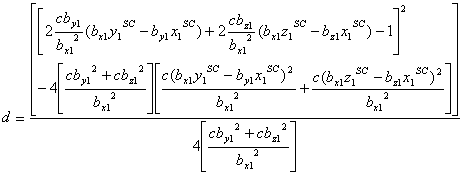
where the above solution for c can then be used to solve
for d according to:
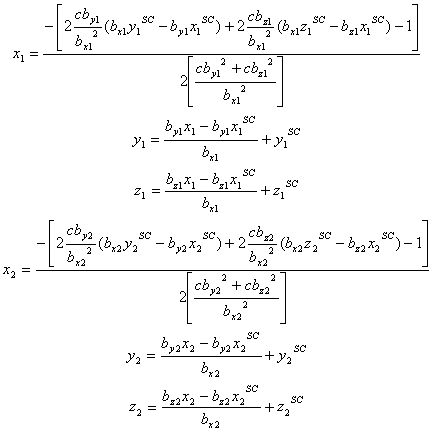
The resulting two tangent points for the straight lines that
intercept the parabola are then given by:
Clearly, the expressions are greatly complicated by the new
analysis, but we have gained the freedom to determine both
c and d independently and we can now follow the
full motions of the shock surface as the solar wind conditions
(wind speed, density, pressure, magnetic field strength) change
provided we can find pairs of closely similar or identical
conditions (save for the IMF direction) to use in the two-point
analysis.
For a more detailed description of the 1-point analysis, you may access
an MS Word document called
Tangency of Line to Parabola (Problem 2).
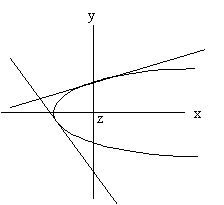 A more complete analysis can be performed by triangulation from two
locations. Events with similar solar wind conditions must be chosen
so that the possible movement of the shock between the two events is
minimized. The figure to the right illustrates this scenario. The
spacecraft location for the two events is presumed to be different,
but the key feature is that the IMF direction changes between the two
events. By using two events to obtain a single solution, both the
standoff distance and the width of the shock can be determined
independently.